What Is Range In Math?

Quick Answer:
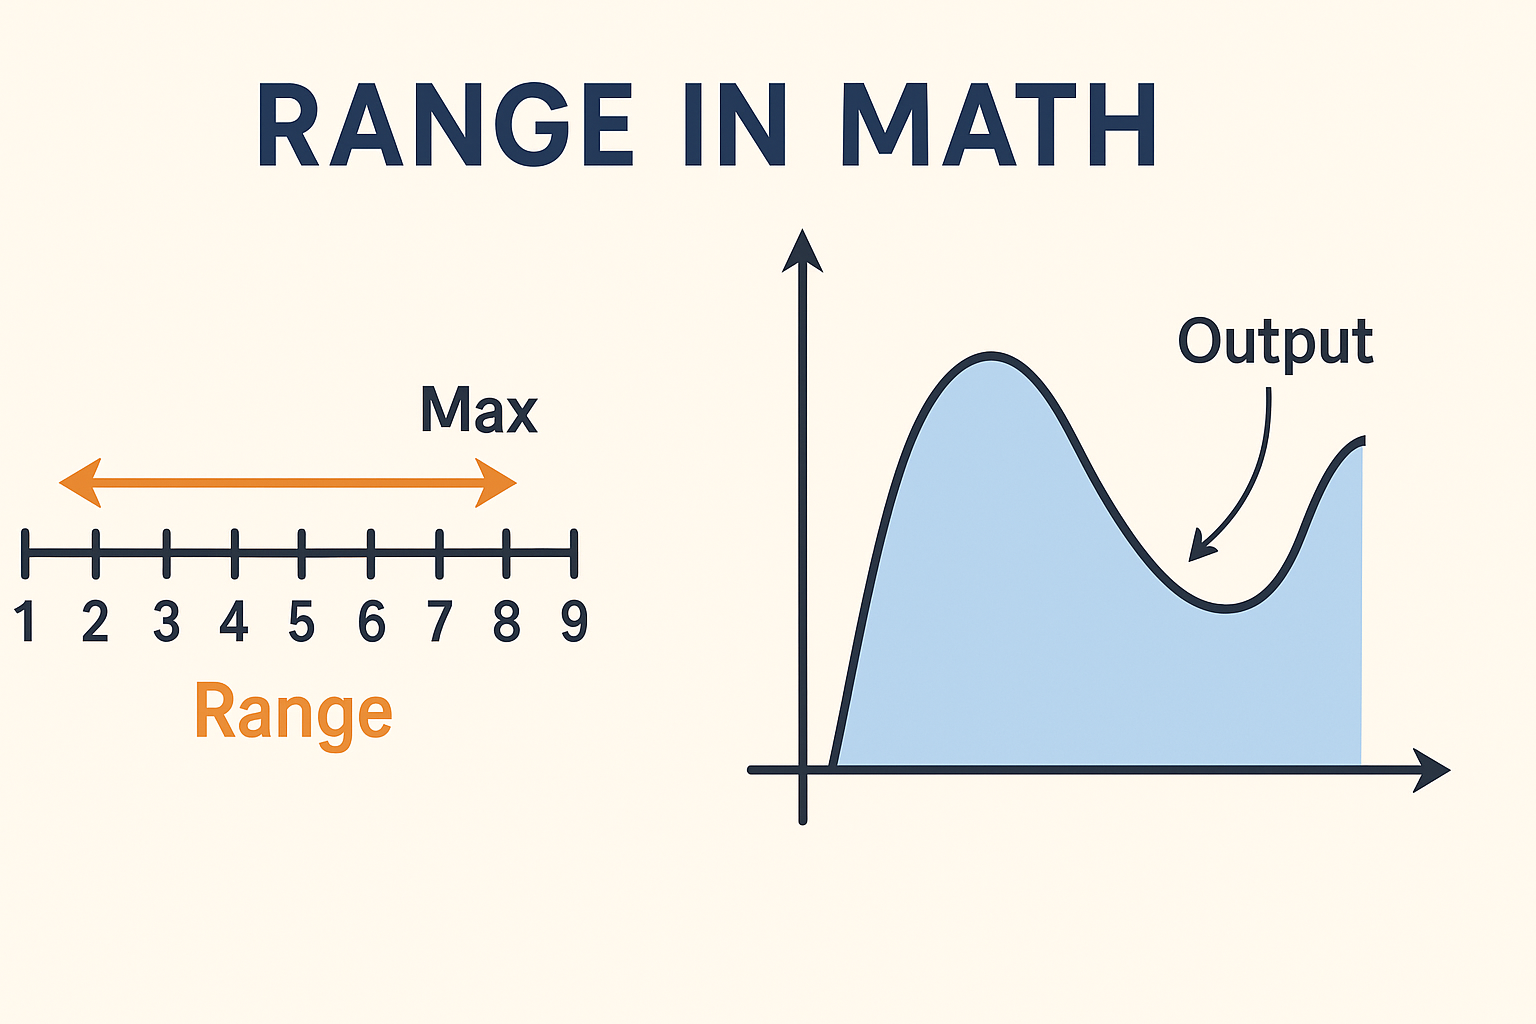
In math, “range” actually has two friendly meanings:
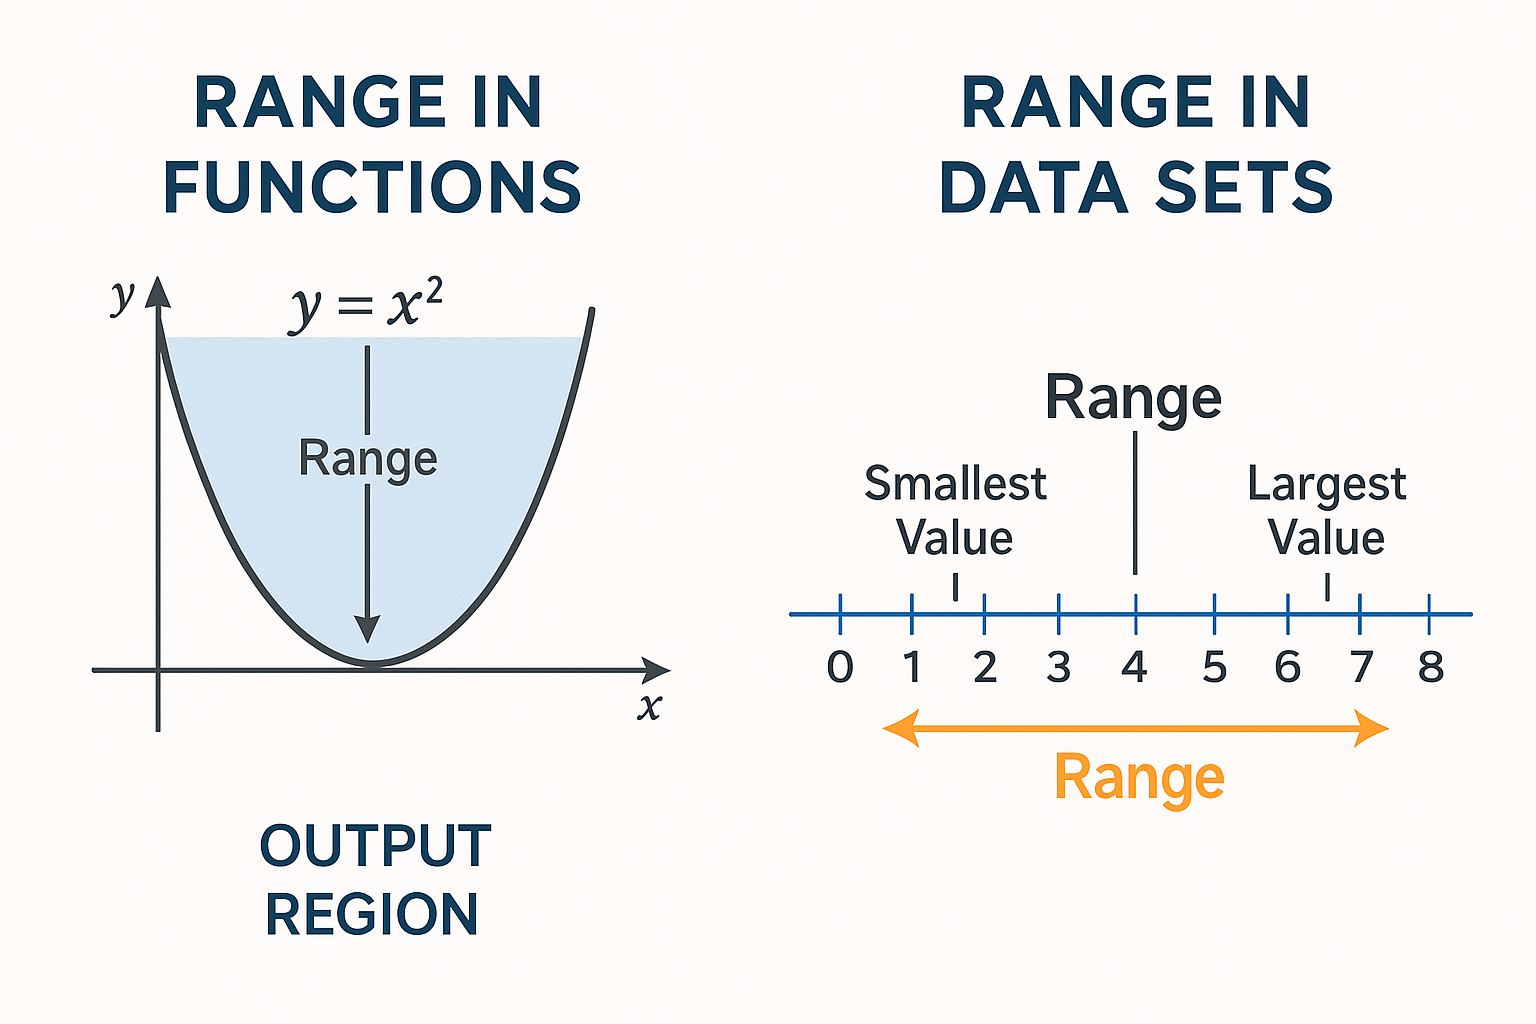
Range of a data set
Think of a list of numbers—like test scores or temperatures. The data range shows how spread out those numbers are.
How to find it: pick the highest value, pick the lowest value, then subtract:
Range = Highest − Lowest
Example: For [3, 8, 5, 10, 6], Range = 10 − 3 = 7
Range of a function
This is the set of all possible outputs a formula (or “machine”) can produce.Example: For f(x) = x², x² is always ≥ 0 no matter what real x you use, so the range is [0, ∞)
Why it matters:
Data range helps you see variability (“Are my scores tightly bunched or wildly spread?”)
Function range tells you what outputs to expect (“Can this formula give me a negative number?”)
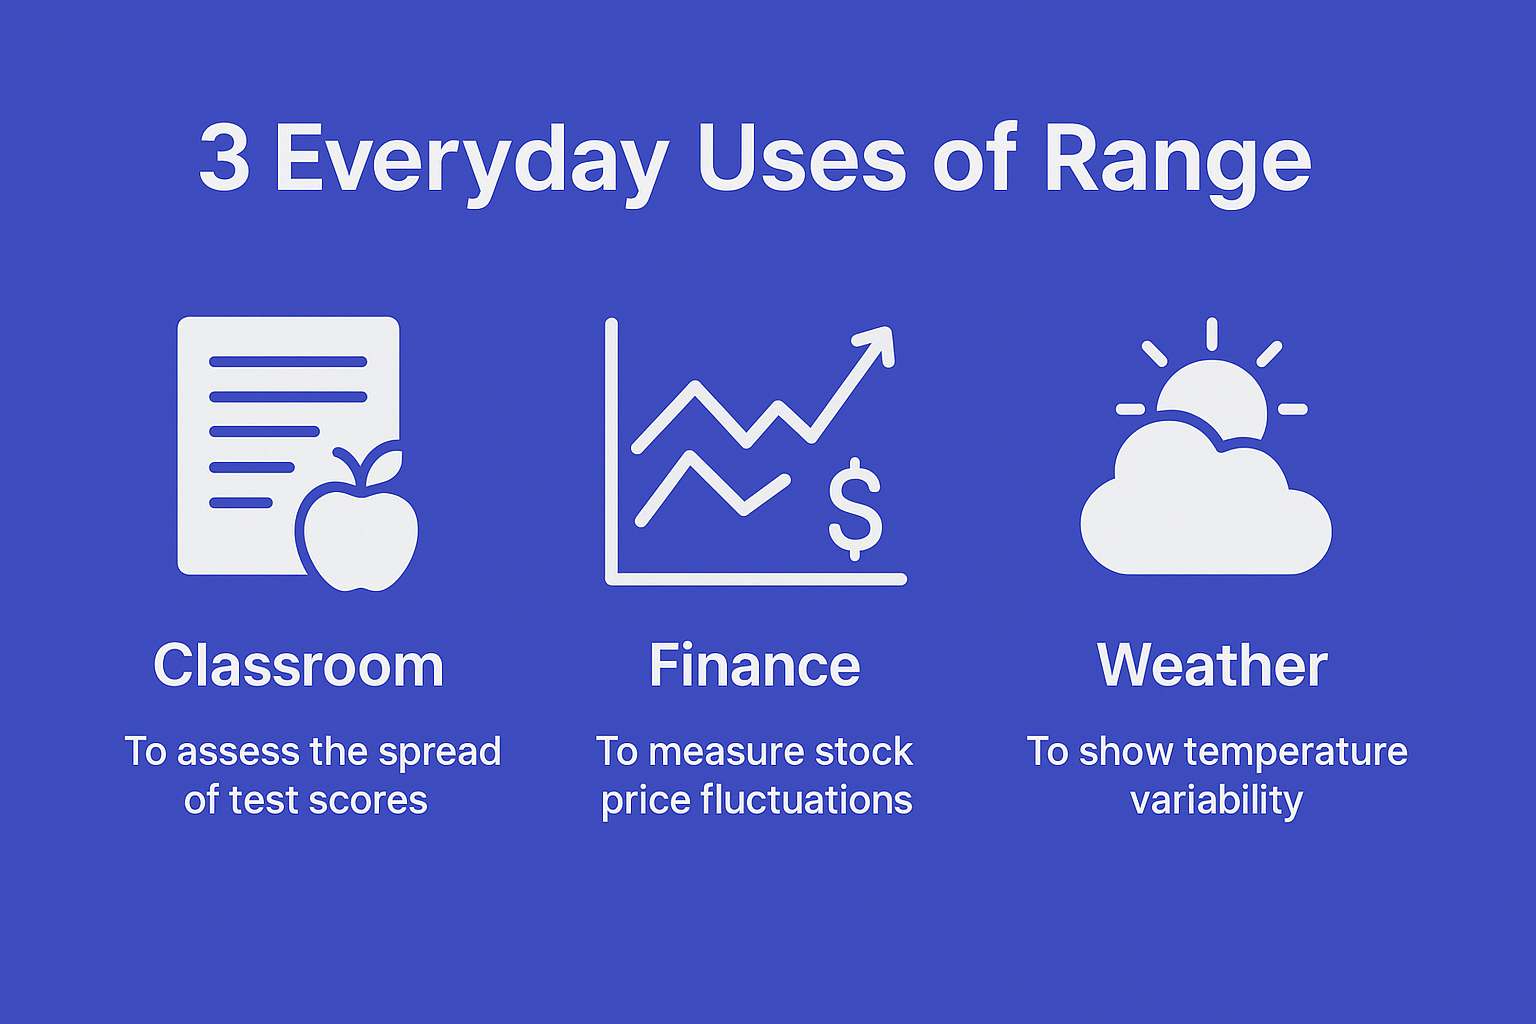
Why Range Matters in Statistics and Everyday Life
Understanding the range gives you a quick snapshot of data variability and statistical spread—key concepts in both academic settings and real-world decision making. As a simple measure of dispersion, range highlights how far apart your lowest and highest values are, making it an ideal first step before diving into more complex analyses like variance or standard deviation.
Use Cases
- Classroom Examples (Test Scores):Teachers often look at the range of student scores to see if a test was too easy (narrow range) or too hard (wide range). A class with scores from 45 to 95 has a range of 50 points, indicating high variability in understanding.
- Finance (Stock Price Fluctuations):Investors monitor the daily range of a stock—its high minus its low—to gauge volatility. A narrow range suggests stability, while a wide range signals rapid price swings and potential risk.
- Weather (Temperature Spans):Meteorologists report the daily temperature range to show how much temperatures fluctuate. For example, if the low is 60°F and the high is 85°F, the range of 25°F can influence everything from clothing choices to energy usage.
Also Visit:
◆“Range is like the first brush stroke on your data canvas—it sets the scene for everything that follows.”– Dr. Elena Martinez, Statistics Educator
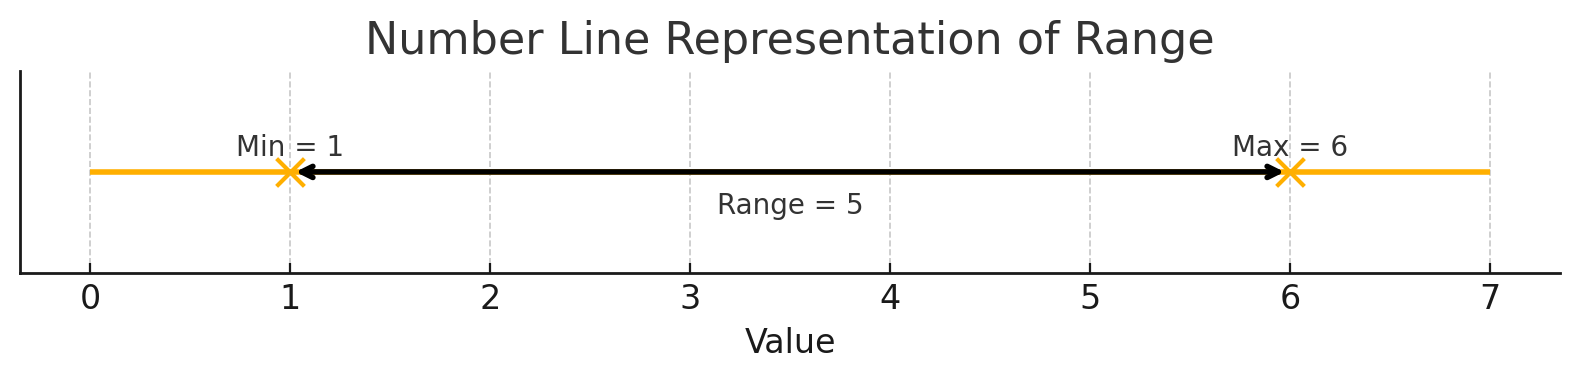
How to Calculate the Range of a Data Set
Understanding how to find the range is quick and straightforward—just three simple steps.
Step-by-Step Procedure
- Identify the maximum value in your list.
- Identify the minimum value in your list.
- Subtract the minimum from the maximum: Range = Max − Min
Example 1
- Data: 1, 2, 5, 3, 6, 4, 4
- Max = 6, Min = 1
- Range = 6 − 1 = 5
Example 2
- Data: 8, 11, 5, 22, 9, 18, 5, 20
- Max = 22, Min = 5
- Range = 22 − 5 = 17
Common Pitfalls & How to Avoid Them
Even a simple metric like range can trip you up if you’re not careful. Here are three of the most frequent mistakes—and how to steer clear of them:
Misidentifying Duplicates
- What happens: You spot a repeated value (e.g. two “4”s) and mistakenly treat them as distinct extremes, or you overlook that duplicates don’t change your max–min gap.
- How to avoid it: Always scan your list for unique high and low values. Whether “4” appears once or five times, the highest and lowest still determine your range. A quick sort or using a spreadsheet’s MIN/MAX functions will guarantee you’re not fooled by repeats.
Overlooking Negative Values
- What happens: When your data set dips below zero, it’s easy to forget that a very negative number is actually “smaller” than a modest positive one—leading to an inflated range if you misread signs.
- How to avoid it: Consciously check for signs (“+” vs. “–”) when identifying your min. A mental checklist—“Is there any value less than zero?”—or a simple filter in Excel (=MIN(range) and =MAX(range)) ensures negative values are properly accounted for.
Ignoring Outliers
What happens: A single extreme value—like a one-off 100 in a batch of test scores around 60–70—can stretch your range dramatically, disguising the true “typical” spread of the rest of your data.How to avoid it: Before reporting range, run a quick outlier check:
- Visual: Plot your data on a box-and-whisker chart to see any points that lie far outside the interquartile band.
- Numeric: Calculate the interquartile range (IQR) and flag values beyond 1.5 × IQR from Q1 or Q3.If you find outliers, consider reporting both the full range and the “trimmed” range (e.g., excluding the top and bottom 5%) to give a clearer picture of your data’s core spread.
By keeping these pitfalls in mind—and leaning on quick checks or simple tools—you’ll ensure your range calculations are both accurate and meaningful.
Related:
How to focus more? Proven Strategies
Working Out Range—Practice Problems
Now that you know how range works, let’s put it into action with a couple of hands-on exercises. Try to calculate each one on your own, then check your answer instantly in our “Try It Yourself” below.
Problem 1: Basic Data Set
Data set: {2, 0, 4, 3, 2, 9, 0, 5, 5, 7}
- Identify the highest value (Max).
- Identify the lowest value (Min).
- Subtract: Range = Max – Min
◆Quick hint: Max = 9, Min = 0, so Range = 9.
Problem 2: Find the Missing Number
Sequence: 3, 4, __, 6You know the range of this sequence is 4. Which number fits the blank?
- Let the missing number be x.
- Range formula: Max(3, 4, x, 6) – Min(3, 4, x, 6) = 4
- Solve for x.
◆Solution insight: The smallest value is 3 and the largest is 6, so 6 – 3 = 3. To make the overall range equal 4, x must be 7 or –1 (but since it’s between 3 and 6 in the list, it must be 5).
🔎 Try It Yourself
Problem 1: Given the data set {2, 0, 4, 3, 2, 9, 0, 5, 5, 7}, calculate the range.
Your range is
Problem 2: In the sequence 3, 4, __, 6, the overall range is 4. Find the missing number.
The missing number is
Range in Functions vs. Range in Data Sets
When you hear “range,” it might be in a statistics class talking about data, or in algebra talking about functions. Though they share a name, these two concepts serve different purposes—and grasping both will give you a clearer picture of how “range” works across all of math.
Defining the Range of a Function
- What it is: All the possible output values (the y-values) a function can produce when you feed it every input in its domain.
- Why it matters: Knowing a function’s range tells you which outputs are possible—and which are impossible.
- Examples:
Domain vs. Range
A quick look at inputs vs. outputs:
| Aspect | Domain | Range |
|---|---|---|
| Definition | All allowable x-values you can feed into a function or list of data points | All resulting y-values (for functions) or the spread between the smallest and largest values (for data sets) |
| Notation | Often written as a set {x | …} or in interval form [–2, 2] |
| Example | For f(x) = √x, domain is [0, ∞) (you can’t take the square root of a negative) | For f(x) = √x, range is [0, ∞) |
◆Domain → Input; Range → Output
Advanced Topics & Variations
As you dig deeper, you’ll find that “range” isn’t just Max – Min on a list—it comes in different flavors and can behave differently when your data include oddballs.
Continuous vs. Discrete Range
A continuous range covers every value between two endpoints, and we write it in interval notation:
- Example: [2, 5] means every real number from 2 up to 5 (including 2 and 5).
A discrete range is a specific set of individual values, often written with curly braces:
- Example: {1, 3, 4} means exactly 1, 3, and 4—nothing in between.
Knowing which type you have tells you how to interpret the results and which notation to use in your write-up.
Range with Outliers
When a single extreme value sneaks into your data—like one $100 figure in a sea of 10s—it can stretch the range so far that it no longer reflects what “most” of your data look like.
- Impact on interpretation: A huge range might just mean one oddball, not that your entire data set is wildly spread out.
- When to report interquartile range instead: If outliers are present, supplement (or replace) your simple range with the IQR—this shows the spread of the middle 50% of values and ignores extreme highs and lows.

Conclusion
Range is one of the simplest yet most powerful tools in your statistical and algebraic toolbox. By understanding how to calculate and interpret range for both data sets and functions, you can:
- Quickly gauge how spread-out a list of numbers really is
- Identify the “output territory” of any formula
- Spot when a single outlier is skewing your view—and know when to switch to IQR for a clearer picture
- Distinguish between continuous intervals and discrete values at a glance
Whether you’re reviewing test scores, modeling stock volatility, or exploring the behavior of complex functions, range gives you a fast, intuitive snapshot of variability.
Next Steps:
- Try out our interactive range calculator to practice with your own data sets.
- Dive deeper into measures of spread with our guides on Variance, Standard Deviation, and Interquartile Range.
- Explore how range fits into real-world applications by checking out our case studies on finance, meteorology, and more.
FAQ Section
- What is a range in math? The range of a data set is the difference between its highest and lowest values, while the range of a function is the set of all possible output values the function can produce.
- How to find the correct range? Identify the maximum value and the minimum value in your data, then subtract: Range = Max − Min.
- How do I work out range? Simply pick the largest number, pick the smallest number, and calculate their difference.
- What is the range in this set of data: 1, 2, 5, 3, 6, 4, 4? The highest value is 6 and the lowest is 1, so the range is 6 − 1 = 5.
- What is the range of the data set 8, 11, 5, 22, 9, 18, 5, 20? The highest value is 22 and the lowest is 5, so the range is 22 − 5 = 17.
- What is the range of {(2, 0, 4, 3, 2, 9, 0, 5, 5, 7)}? The highest value is 9 and the lowest is 0, so the range is 9 − 0 = 9.
- How do you find the range example? Use a sample list—say [3, 7, 2]—then calculate 7 − 2 = 5 to see the range is 5.
- How do you find the missing number in a range? Let the blank be x, set Max(x, others) − Min(x, others) equal to the known range, and solve for x.
- What is the range of a set function? For a function, list all possible outputs (y-values) across its domain; that collection of y-values is the function’s range.